
A software solution for every season
Precision farming is about answering questions that can make you more profitable in all your field activities. SMS Software is an easy-to-use, decision-making tool that helps you get the most out of every acre.

Planting
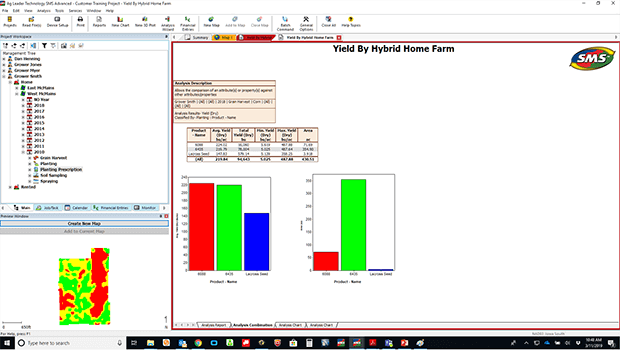
- Choose seed based on historic yield performance
- Create planter performance reports and charts
- Satisfy government reporting needs

Application
- Track variable rate application operations
- Record application operations for record keeping
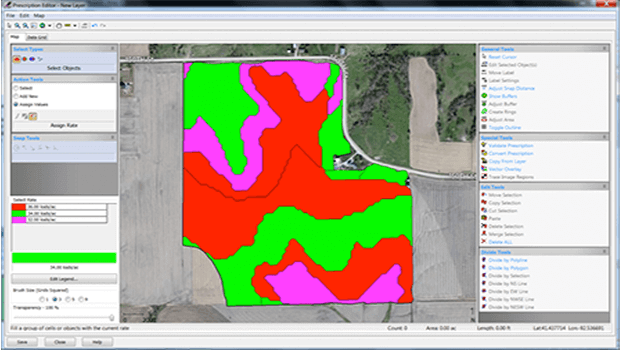
- Create variable rate prescriptions

Harvest
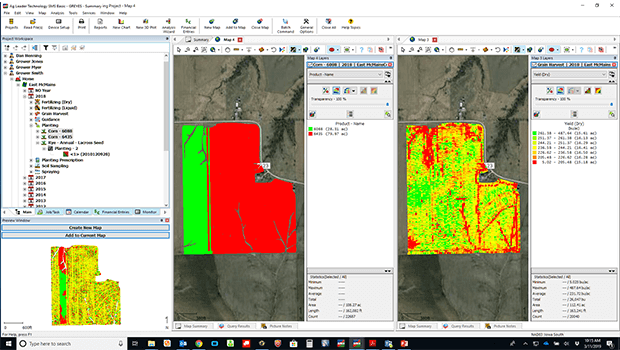
- Analyze harvest data
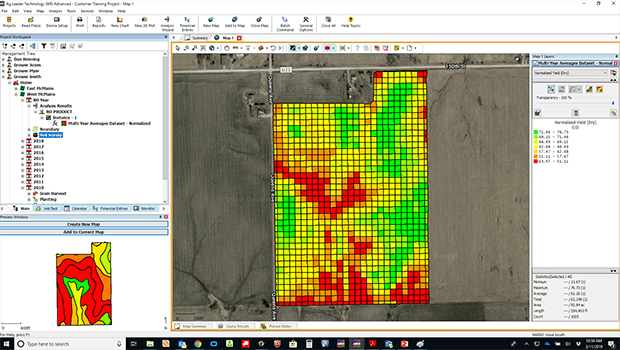
- Discover yield trends using multiple years’ data
- Create harvest reports and charts or use query tools

Field Stewardship
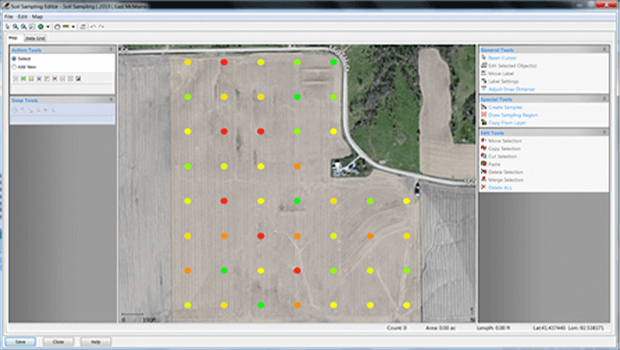
- Manage soil sampling
- Create field tile plans
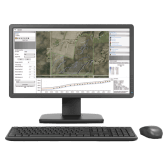
- Download soil survey maps and view aerial and road background maps
- Plan and document crop plans and practices
SMS Basic
Turn field data into smart management decisions using information gathered from planting through harvest.
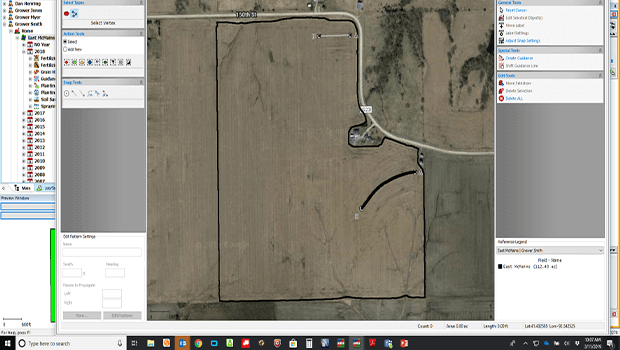
Simplify Guidance Line Management
Manage Soil Sample Activities
Precisely Place Inputs
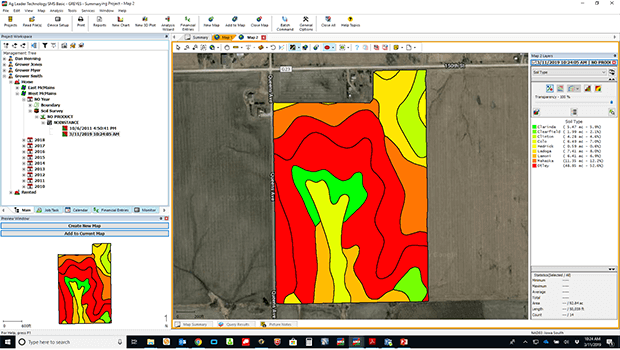
Download Soil Survey Maps
Discover Yield Influencers
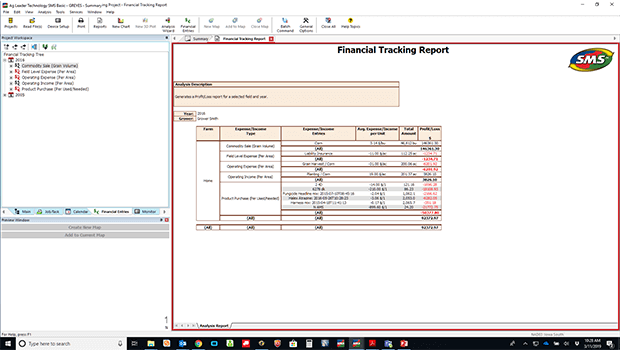
Easily Track Financials
SMS Basic
Turn field data into smart management decisions using information gathered from planting through harvest.
SMS Advanced
Farmers and consultants can enjoy all the features of SMS Basic plus more in-depth analysis.
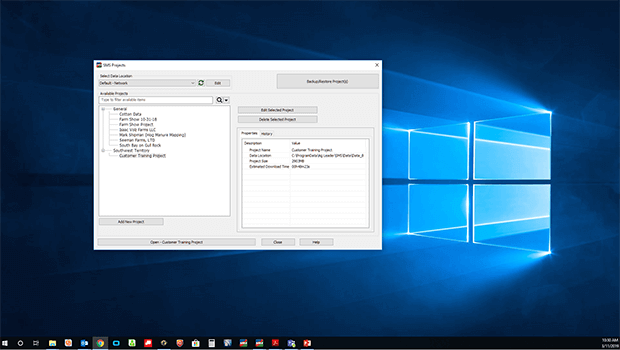
Efficiently Manage Data
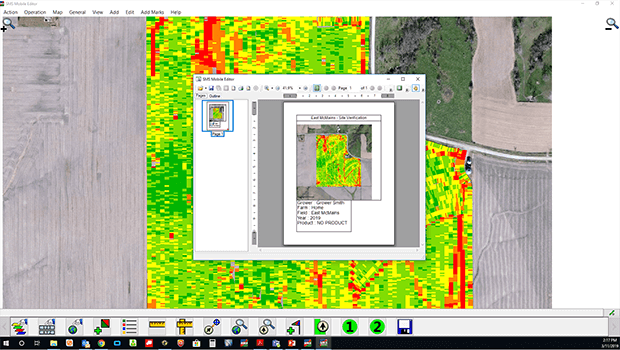
Create Report and Print Layouts
Discover Yield Influencers
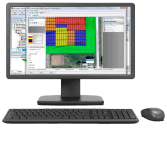
Reveal Management Zones
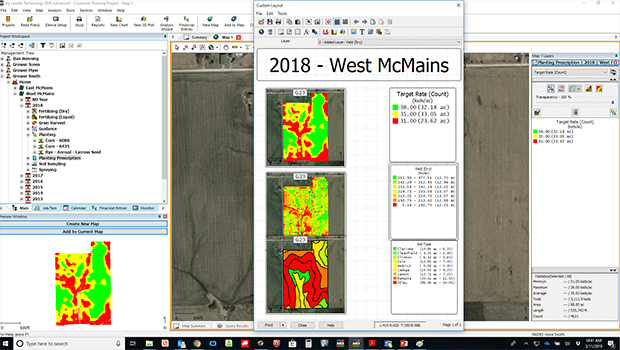
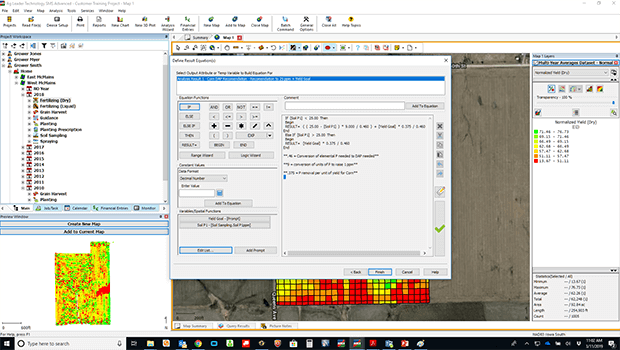
Create Formula-Based Prescriptions
Interpret NIR Imagery
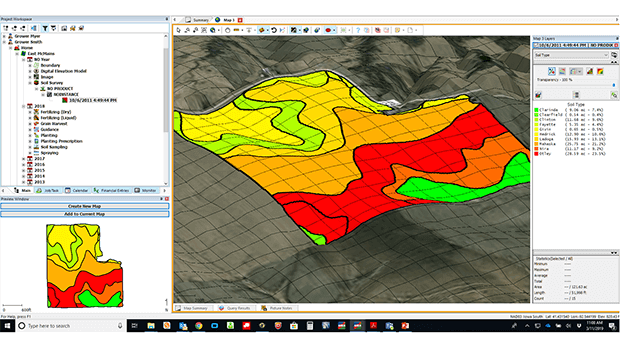
Better Visualize Field Topography
Manage Operational Activities
SMS Advanced
Farmers and consultants can enjoy all the features of SMS Basic plus more in-depth analysis.
Additional SMS Advanced Modules
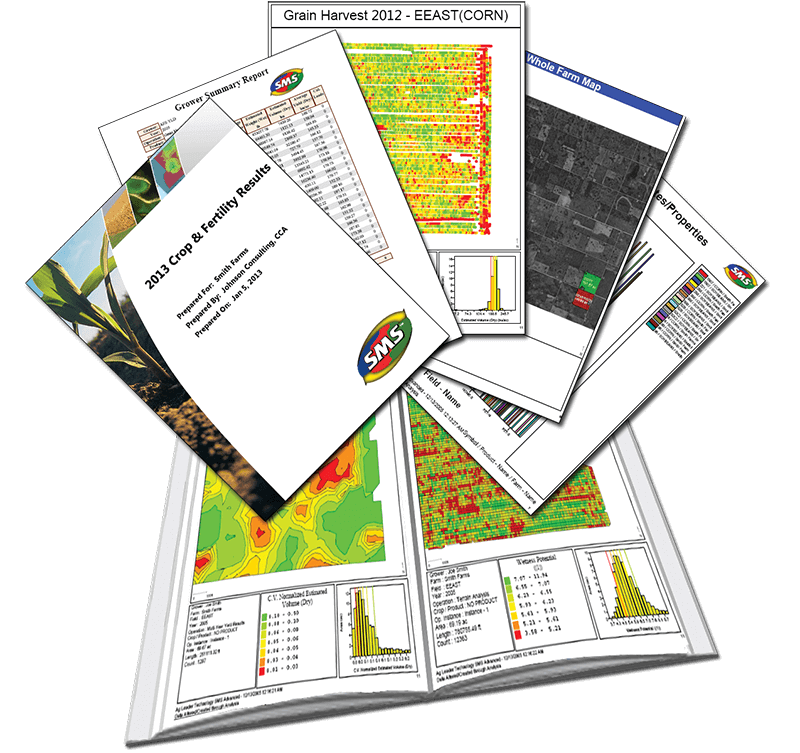
Booklet Printing
Create personalized booklets for each client using the Booklet Printing Module. Determine the reports, graphs, maps, charts, and analysis results to be included; SMS does the rest. Export as HTML or PDF files to be emailed or uploaded to the web.
Water Management Module
Map out and plan tile lines while visualizing the field from different perspectives and layering yield or soil type maps.
Plot Prescription Module
Strategically place and define in-field research plots in the office and use these plot prescriptions to plant in the field.

Field Trial Module
Designing, placing, and replicating field trials is now easier than ever before. Additionally, new automated trial analysis tools to drive improved management practices are coming soon.
SMS Mobile
Collect information from the field and sync with desktop software.
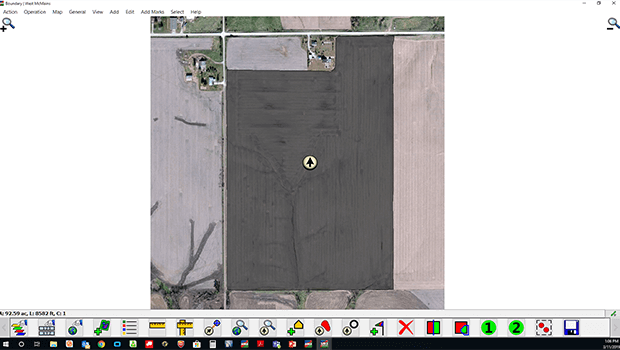
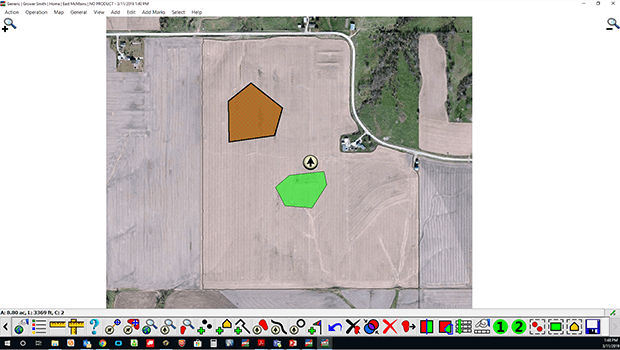
Boundary Mode
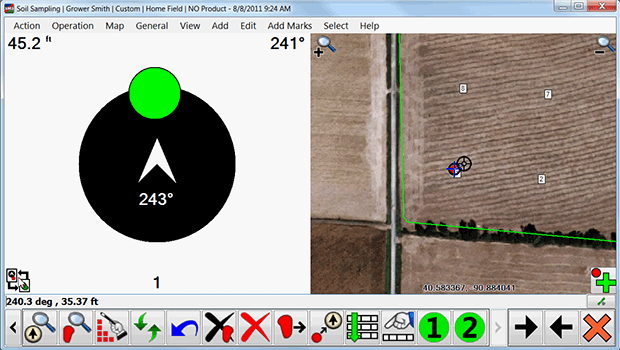
Soil Sampling
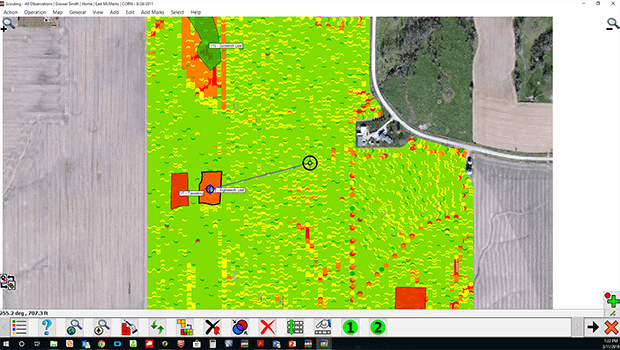
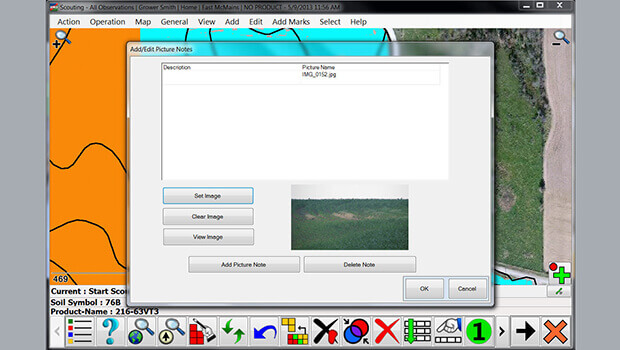
Crop Scouting Mode
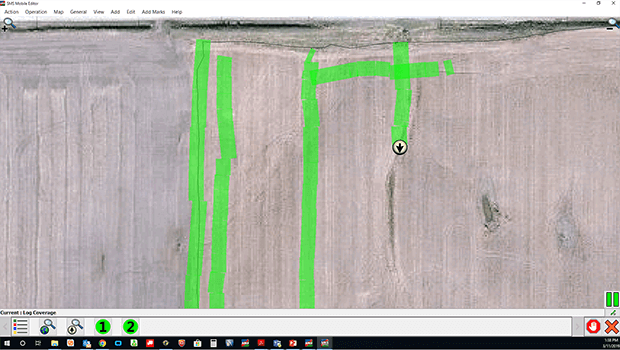
Coverage Mode
General Logging Mode
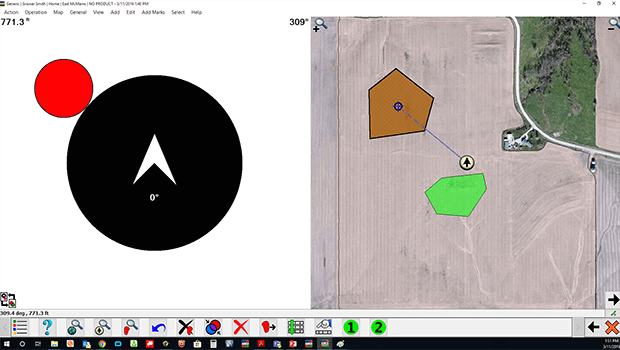
Navigation View
Picture Notes
Printing Options
SMS Mobile
Collect information from the field and sync with desktop software.
Compare SMS Features
SMS Basic
- Features:
- » File Processing from Most Precision Ag Displays
- » Sorts Data by Geography
- » Generate Crop Plans
- » Create, Manage and Export Guidance Lines
- » Print Summary Maps, Charts and Reports
- » Aerial/Road Backgrounds
- » Write Simple Prescriptions
- » Prescription Budget Tool
- » Query Tools to Analyze Specific Areas
- » Check for Updates
- » View Current and Historical Weather for Your Fields
- » Utilize Satellite (Sentinel) Imagery to Identify Healthy Trends in Your Fields
- » Soil Survey Import (U.S. Only)
- » Send/Receive Files with AgFiniti*
*Service available for purchase
SMS Advanced
- SMS Basic Features Plus:
- » Project Management (5)
- » Calendar View
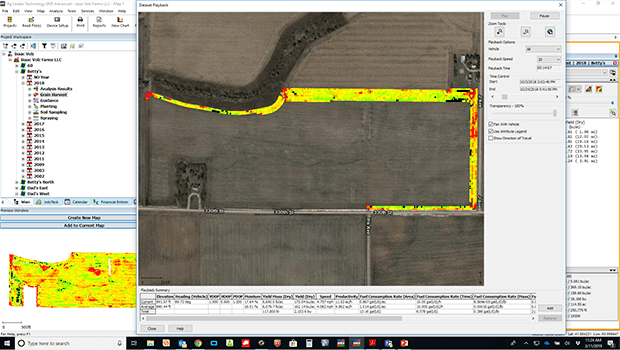
- » Dataset Playback
- » 3D Plotting and Terrain Viewing
- » Comparison Analysis
- » Correlation Analysis
- » Terrain Analysis
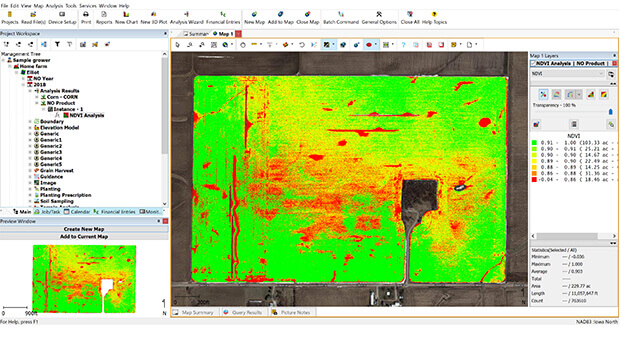
- » NDVI Analysis
- » Profit/Loss Mapping
- » Backup Scheduling
- » Zone Analysis
- » Equation Writing
- » Multi-Year Averaging
- » Display Elevation Surface Contours
- » Multiple Storage Locations (No Limits)
- » Booklet Printing**
- » Water Management**
- » FieldTrials**
- » Plot Prescription**
**Optional module
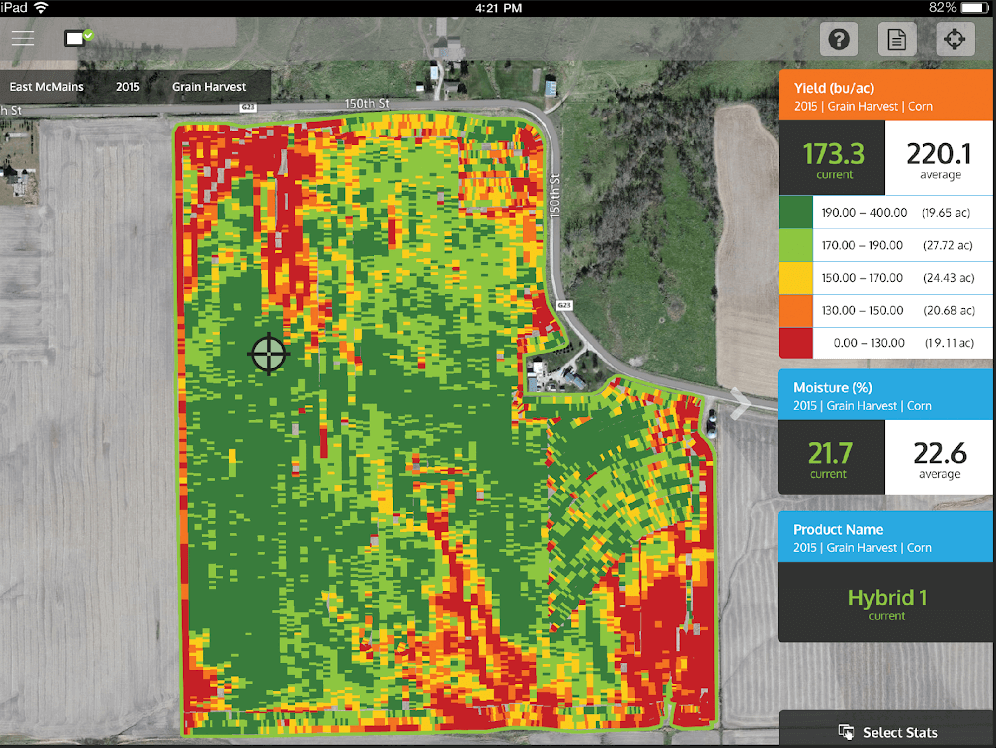
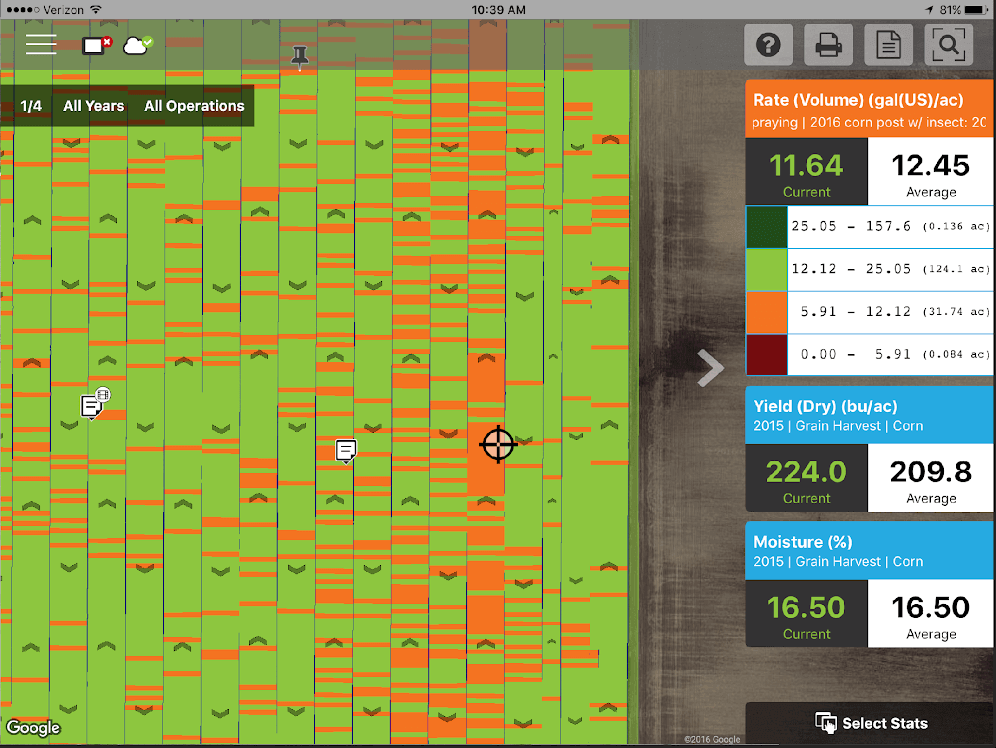
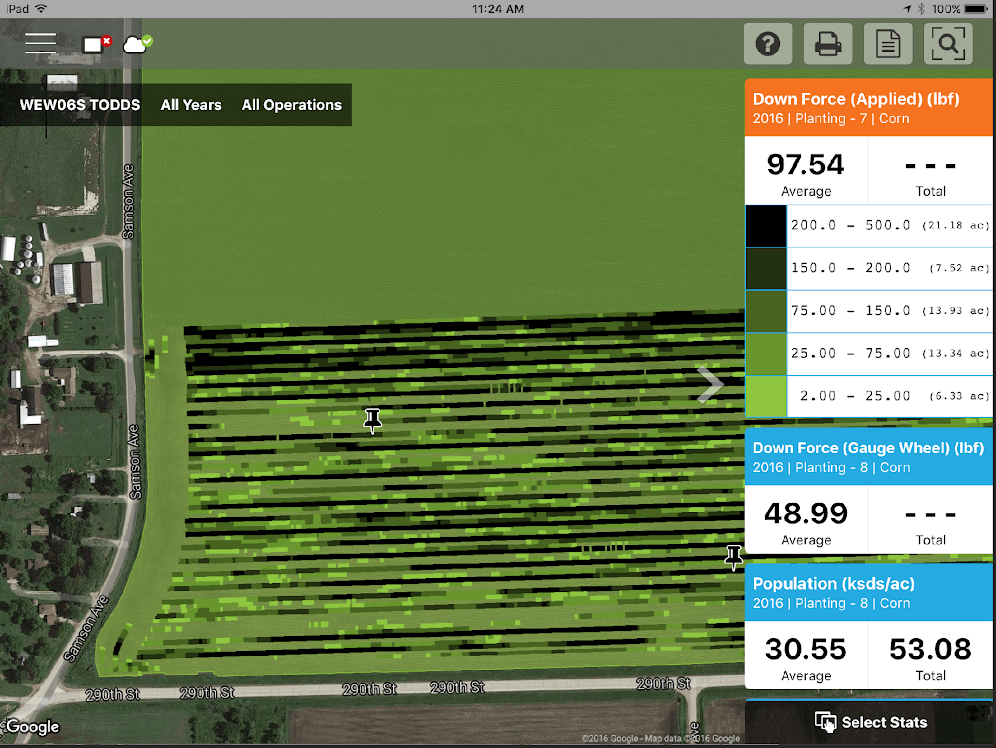
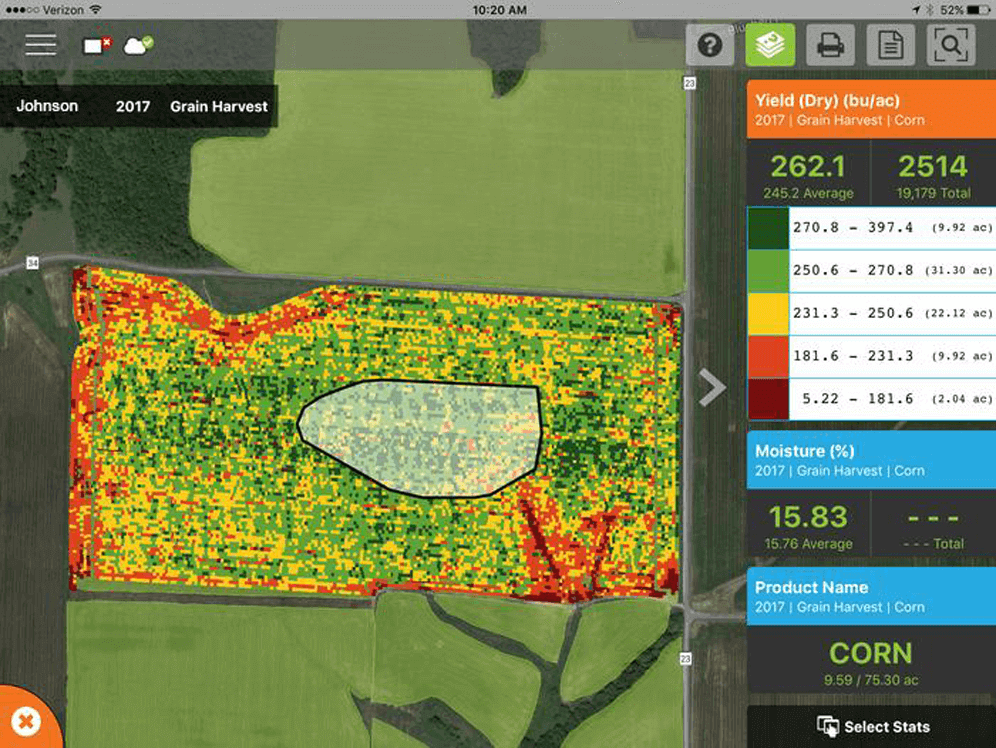
View Your Data Anywhere
View your data anywhere, from any device when using SMS in conjunction with the AgFiniti! Export your data from SMS and view your row-by-row planting, application, harvest data, and more! Utilize your favorite mobile device whether it’s an iPad, tablet, laptop, or smartphone.

AgFiniti Connections
AgFiniti connects with other digital platforms to enable you to seamlessly map, report, and analyze all your information in one place anytime, anywhere, and on any device. Combined with the power of SMS Software, it’s the most versatile platform for gaining insights and decision making across your entire farm.
View your progress on the go
Download our AgFiniti app and sync your tablet or phone with your Ag Leader devices to view data from home or while you’re on the road.
SEE THE WHOLE PICTURE WITH THE AGFINITI APP
Download the AgFiniti App Today